
Now open
Lumen FuturesLumen Futures is now openA US futures prop firmLumen Futures is now open90% profit split, no daily loss limit, one-time feeLumen Futures is now open60% off with code LUMEN60Lumen Futures is now openWant SyncFutures free or discounted? Click here to see how

The Trading Journal Built for Futures Traders

Automatically capture every trade, visualize your performance with calendar heatmaps and equity curves, and uncover the behavioral patterns behind your results.

AI Trading Coach

Turn your journal into a coach with Synca

Behavioral insights show you the patterns. Synca, our AI coach, goes one step further — it reads your real trades and tells you where your edge is, why you're losing, and how to fix a leak. Every plan includes one free insight each Friday; add Synca for a fresh insight every day plus chat any time.

Daily insightsA fresh AI insight every day — not just one a week
Chat about your tradesAsk anything; it knows your numbers to the cent
Grounded, not genericBuilt on your journal — educational coaching, never signals
Trade Tracking

Every Trade, Automatically Captured

Your trades are synced the moment they happen. No copy-pasting, no spreadsheets — just a complete, searchable record of every fill.

  • Auto-sync from Tradovate, Rithmic, NinjaTrader, and ProjectX
  • CSV import for historical trades from supported brokers
  • Filter by symbol, account, date range, or side
  • Add annotations, notes, and tags to any trade
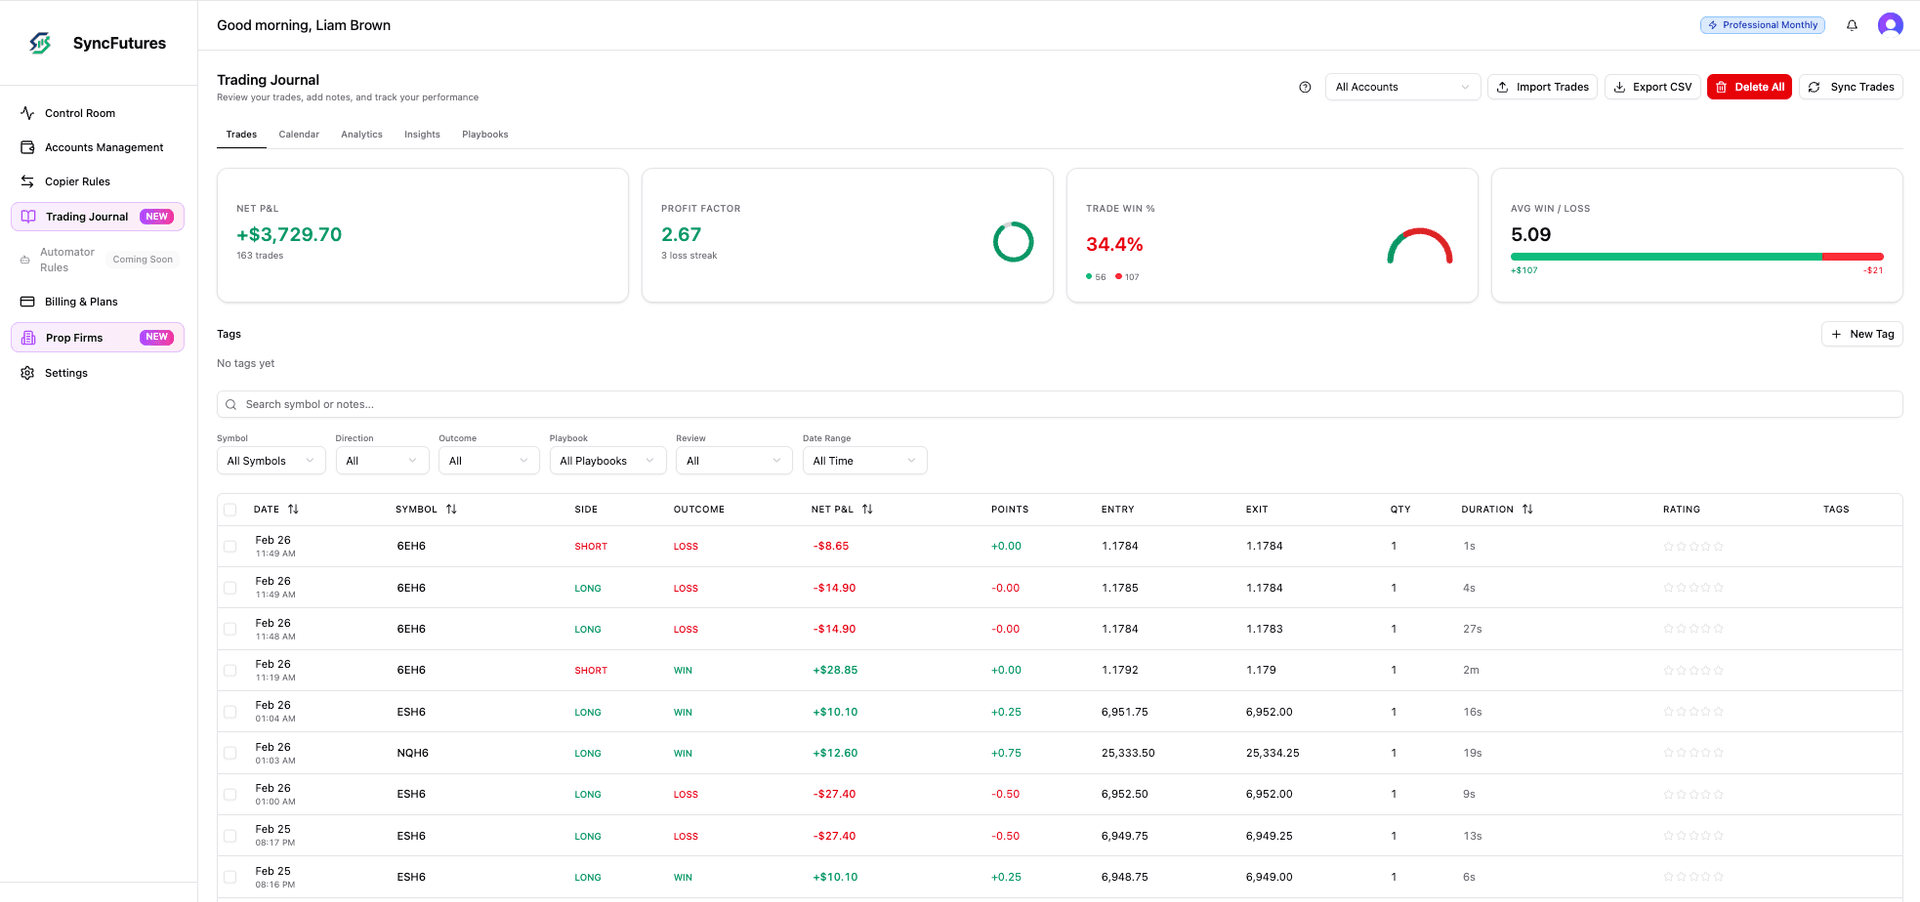
SyncFutures trading journal trades table with auto-synced futures trades
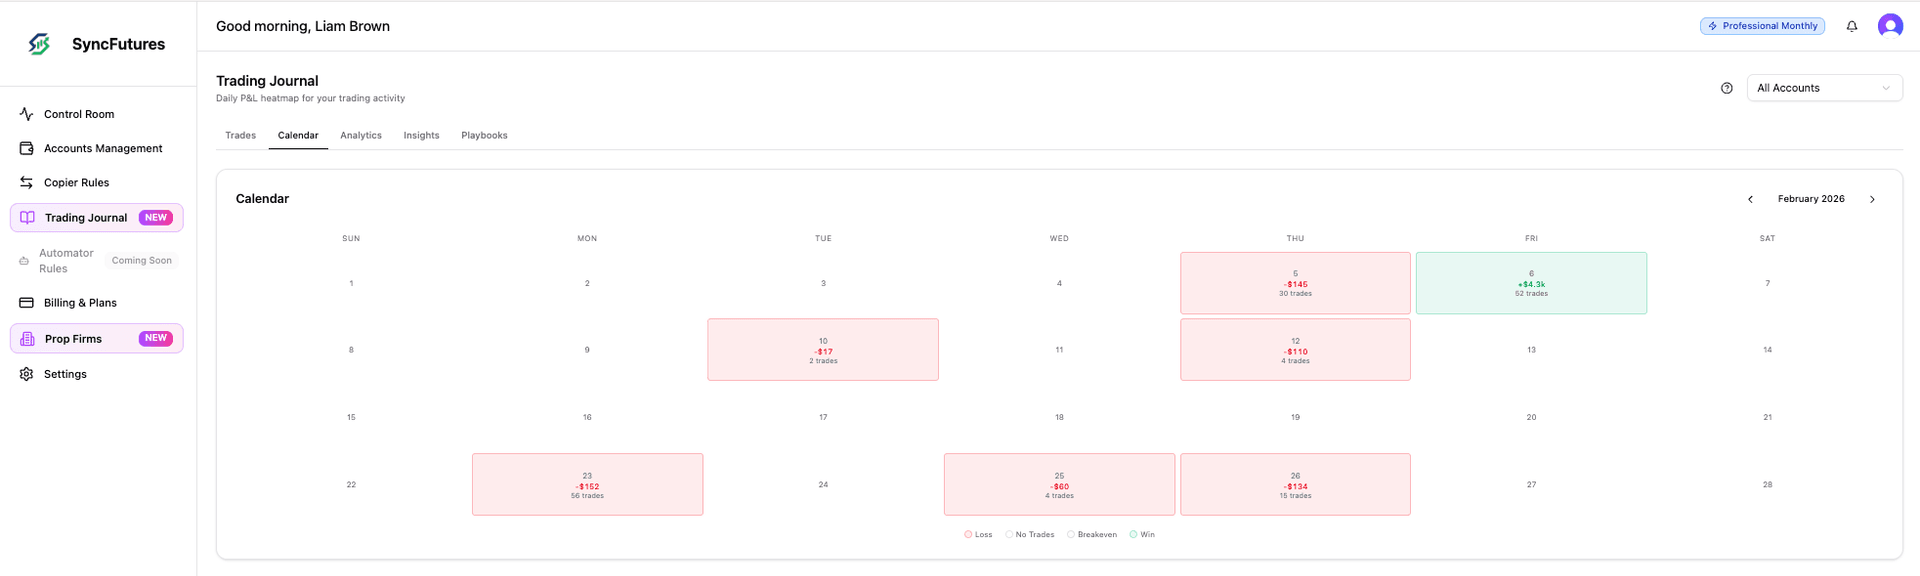
Calendar heatmap showing daily P&L for futures trades
Calendar View

Your P&L at a Glance

The calendar heatmap turns months of trading data into an instant visual summary. Spot winning streaks, losing runs, and consistency patterns in seconds.

  • Color-coded daily P&L — green for wins, red for losses
  • Intensity reflects magnitude of gains and losses
  • Weekly and monthly overview of trading activity
  • Quickly identify your best and worst trading days
Analytics

Data-Driven Trading Decisions

Go beyond P&L with multi-dimensional analytics that reveal when, how, and why you trade best.

  • Equity curve and drawdown tracking over time
  • Time-of-day and day-of-week performance breakdowns
  • Trade duration analysis — are quick scalps or longer holds more profitable?
  • P&L distribution to understand your typical trade outcomes
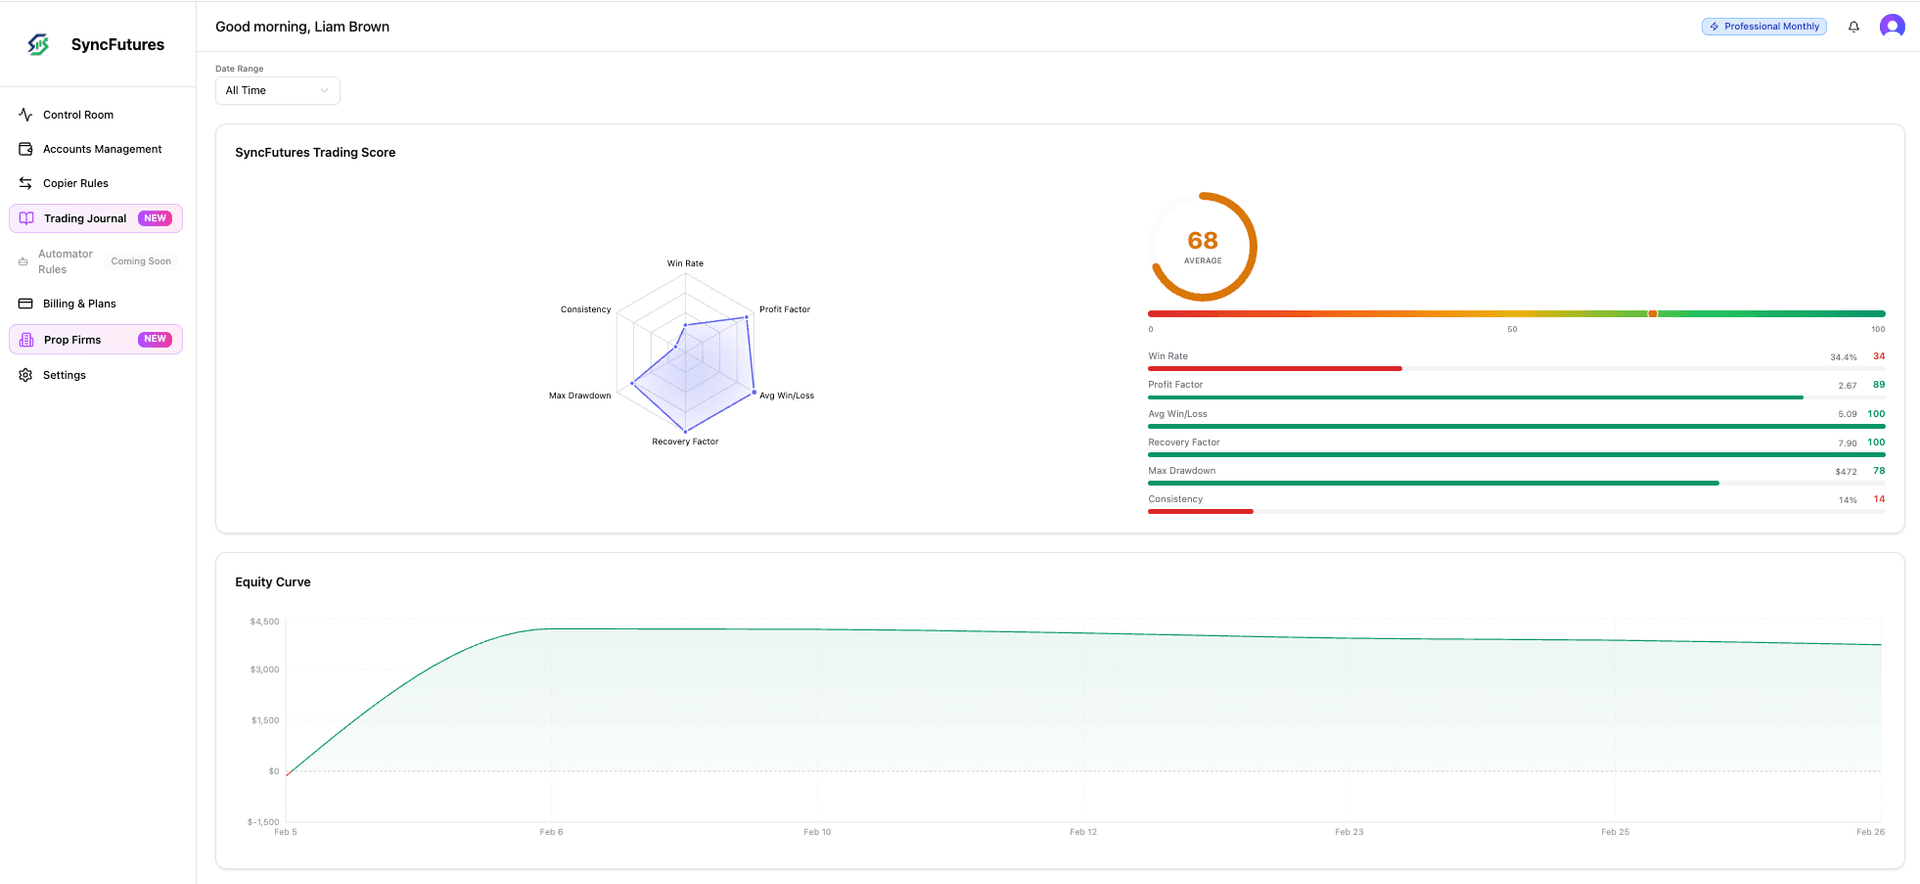
Equity curve and analytics charts for futures trading journal
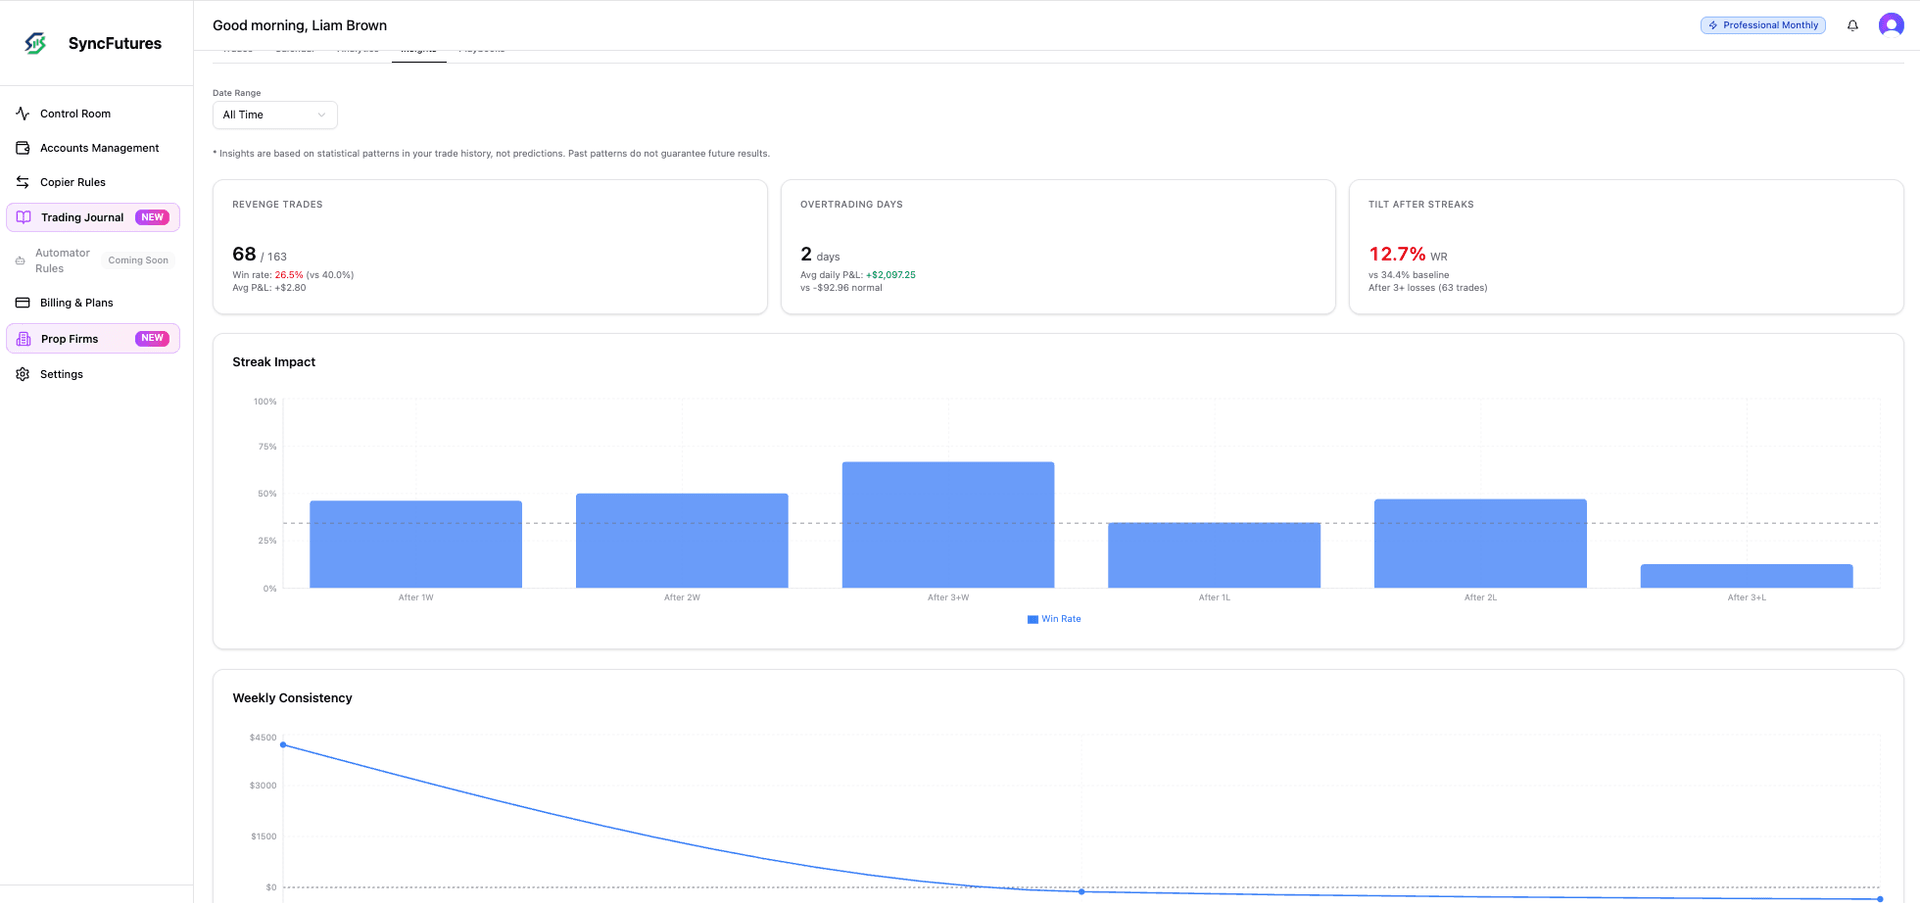
Behavioral insights page showing streak analysis and trading psychology metrics
Behavioral Insights

Understand the Trader Behind the Trades

Your biggest edge isn't a setup — it's self-awareness. Behavioral insights surface the patterns you can't see in a P&L statement.

  • Winning and losing streak impact on subsequent performance
  • Consistency scoring across sessions and timeframes
  • Revenge trading and tilt detection
  • Emotional pattern recognition tied to trade outcomes
Annotations

Turn Every Trade into a Lesson

The best traders review their trades. Annotations let you capture context that numbers alone can't tell you.

  • Add detailed notes and lessons learned to each trade
  • Track your emotional state and assign quality ratings
  • Tag trades with playbooks to measure setup performance
  • Use custom tags to categorize trades your way
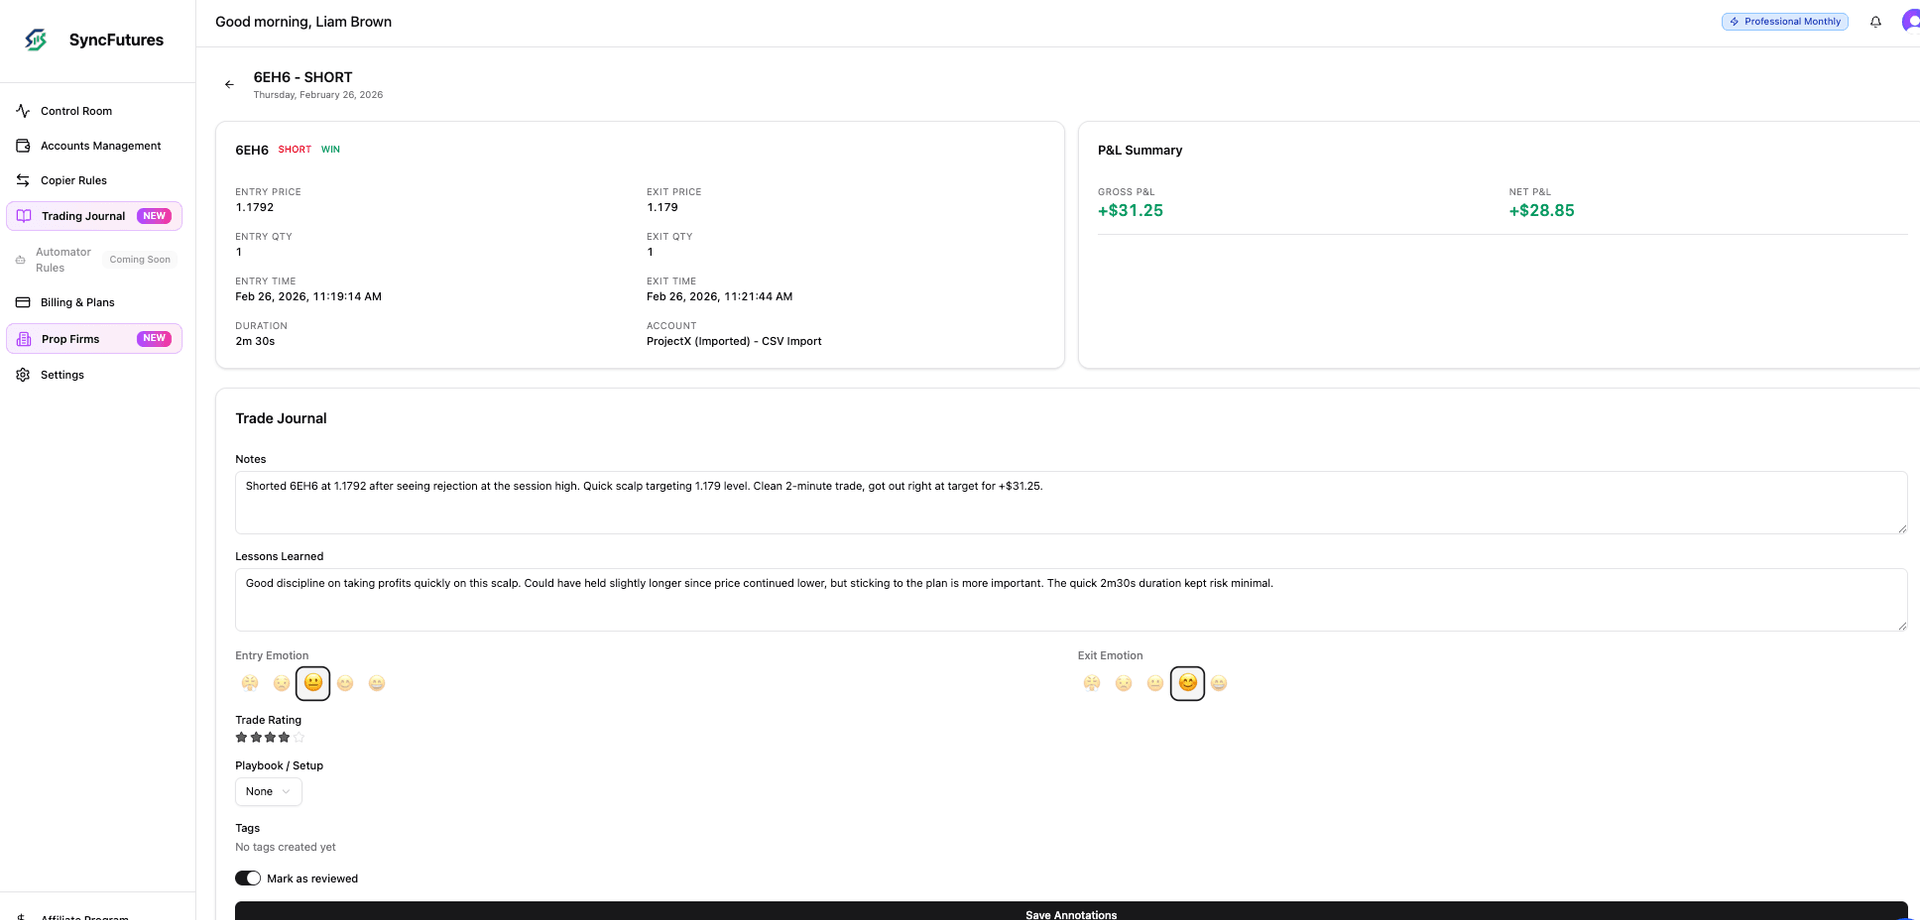
Trade annotation view with notes, emotions, ratings, and playbook tags

Everything You Need in a Trading Journal

Built specifically for futures traders who want to improve systematically.

Auto Sync
Trades are automatically captured from your connected broker accounts.
  • Tradovate, Rithmic, NinjaTrader, ProjectX
  • Real-time trade import
  • No manual entry required
CSV Import
Import historical trades from supported brokers via CSV export files.
  • Tradovate, Rithmic, NinjaTrader, ProjectX
  • Preview before importing
  • Automatic duplicate detection
Calendar Heatmap
See your daily P&L at a glance with a color-coded calendar view.
  • Green/red day visualization
  • Weekly and monthly views
  • Instant consistency check
Advanced Analytics
Equity, drawdown, and breakdowns by every axis — plus side-by-side period comparisons.
  • Equity curve, drawdown, P&L distribution
  • Symbol, day-of-week, time-of-day, session (Asia/London/NY)
  • Best & Worst Setups leaderboard + Compare Periods
Behavioral Insights
Understand the psychology behind your trading performance.
  • Streak impact analysis
  • Revenge trading detection
  • Tilt & consistency metrics
Rich Annotations
Add context to every trade with notes, emotions, and playbooks.
  • Notes & lessons learned
  • Emotional state & quality ratings
  • Playbook & custom tags
Risk & Expectancy
Anchor your risk on every trade and see whether your edge is actually robust.
  • R-multiple per trade (frozen at entry)
  • Expectancy and R-distribution
  • Risk of Ruin, Kelly %, and K-Ratio
Goals & Loss Limits
Per-account targets and loss limits — daily, weekly, monthly. Informational only; we don't auto-stop you.
  • Daily / weekly / monthly P&L targets
  • Daily + weekly loss limits
  • Per-account or All Accounts scope
Self-Coaching Loop
Mark rule adherence and mistakes on every trade, then see exactly what your discipline is costing you.
  • Mistake tags + Followed-rules flag
  • Edge Leak: "+$X recoverable by following your rules"
  • Guided Weekly Reviews with frozen stats

Why Traders Choose SyncFutures Journal

A complete journaling solution — no extra tools needed.

Automatic trade capture — no manual entry
Works with Tradovate, Rithmic, NinjaTrader, and ProjectX
CSV import for historical trades from supported brokers
Calendar heatmap for daily P&L at a glance
Equity curve, drawdown, and performance analytics
Time-of-day, day-of-week, and trading-session (Asia / London / NY) breakdowns
Behavioral insights: streaks, revenge trading, tilt detection
Rich annotations: notes, emotions, ratings, playbooks, tags
R-multiple tracking with frozen-at-entry risk anchor
Expectancy, R-distribution, and Edge Quality (Risk of Ruin / Kelly / K-Ratio)
Per-account P&L targets and daily + weekly loss limits
Structured mistake tags + Followed-rules flag on every trade
Edge Leak: see how much P&L your discipline would recover
Best & Worst Setups leaderboard + Compare Periods (A/B any two date ranges)
Guided Weekly Reviews with a frozen stats snapshot
Master-accounts-only filter for copy-trading masters
Multi-account support across all connected brokers
Included free with every SyncFutures plan

Frequently Asked Questions

How does the trading journal sync my trades automatically?
Once you connect your broker account (Tradovate, Rithmic, NinjaTrader, or ProjectX), SyncFutures automatically imports your trades in real time. Every fill, every order — captured without any manual entry. You can also import historical trades via CSV from any broker.
What analytics does the trading journal provide?
The journal includes an equity curve, drawdown chart, net daily P&L, time-of-day performance, day-of-week breakdown, trade duration analysis, and P&L distribution. These help you identify when and how you trade best.
What are behavioral insights?
Behavioral insights analyze your trading patterns beyond raw P&L. They detect winning and losing streaks and their impact on your performance, consistency metrics, revenge trading patterns, and tilt detection — helping you understand the psychology behind your results.
Can I annotate individual trades?
Yes. Every trade can be annotated with notes, lessons learned, emotional state, a quality rating, playbook tags, and custom tags. This makes it easy to review your trades and track what setups work best for you.
Is the trading journal included with my SyncFutures subscription?
Yes! The trading journal is included free with every SyncFutures plan — Starter, Professional, and Ultimate. There are no extra fees or add-ons required.
Can I import historical trades via CSV?
Yes. The CSV import feature supports exports from Tradovate, Rithmic, NinjaTrader, and ProjectX. Just select your broker, upload the CSV file, preview the trades, and import — all with duplicate detection built in.
How does the calendar heatmap work?
The calendar heatmap shows your daily P&L as a color-coded grid — green for profitable days, red for losing days. The intensity of the color reflects the magnitude. It gives you an instant visual overview of your trading consistency over weeks and months.
Does the journal support multiple accounts?
Yes. You can track trades across all your connected broker accounts in one unified journal. Filter by account, broker, or symbol to drill into specific performance segments.

Start Journaling Your Trades Today

Included free with every SyncFutures plan. No add-ons, no extra fees.

GDPR & CCPA Compliant
SSL/TLS Encrypted
7-day free trial